Redis 高负载下的中断优化
来自:美团点评技术团队
作者:
骁雄,14年加入美团点评,主要从事MySQL、Redis数据库运维,高可用和相关运维平台建设。
春林,17年加入美团点评,毕业后一直深耕在运维线,从网络工程师到Oracle DBA再到MySQL DBA 多种岗位转变,现在美大主要职责Redis运维开发和优化工作。
背景
2017年年初以来,随着Redis产品的用户量越来越大,接入服务越来越多,再加上美团点评Memcache和Redis两套缓存融合,Redis服务端的总体请求量从年初最开始日访问量百亿次级别上涨到高峰时段的万亿次级别,给运维和架构团队都带来了极大的挑战。
原本稳定的环境也因为请求量的上涨带来了很多不稳定的因素,其中一直困扰我们的就是网卡丢包问题。起初线上存在部分Redis节点还在使用千兆网卡的老旧服务器,而缓存服务往往需要承载极高的查询量,并要求毫秒级的响应速度,如此一来千兆网卡很快就出现了瓶颈。经过整治,我们将千兆网卡服务器替换为了万兆网卡服务器,本以为可以高枕无忧,但是没想到,在业务高峰时段,机器也竟然出现了丢包问题,而此时网卡带宽使用还远远没有达到瓶颈。
定位网络丢包的原因
从异常指标入手
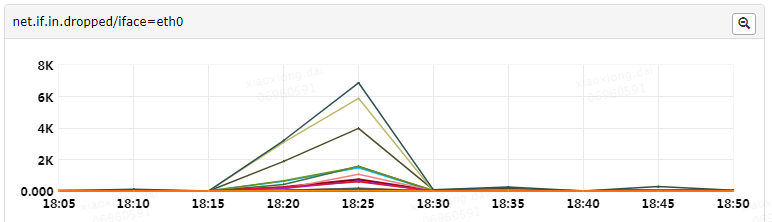
首先,我们在系统监控的net.if.in.dropped指标中,看到有大量数据丢包异常,那么第一步就是要了解这个指标代表什么。
这个指标的数据源,是读取/proc/net/dev中的数据,监控Agent做简单的处理之后上报。以下为/proc/net/dev 的一个示例,可以看到第一行Receive代表in,Transmit代表out,第二行即各个表头字段,再往后每一行代表一个网卡设备具体的值。

其中各个字段意义如下:
| 字段 | 解释 |
|---|---|
| bytes | The total number of bytes of data transmitted or received by the interface. |
| packets | The total number of packets of data transmitted or received by the interface. |
| errs | The total number of transmit or receive errors detected by the device driver. |
| drop | The total number of packets dropped by the device driver. |
| fifo | The number of FIFO buffer errors. |
| frame | The number of packet framing errors. |
| colls | The number of collisions detected on the interface. |
| compressed | The number of compressed packets transmitted or received by the device driver. (This appears to be unused in the 2.2.15 kernel.) |
| carrier | The number of carrier losses detected by the device driver. |
| multicast | The number of multicast frames transmitted or received by the device driver. |
通过上述字段解释,我们可以了解丢包发生在网卡设备驱动层面;但是想要了解真正的原因,需要继续深入源码。
/proc/net/dev的数据来源,根据源码文件net/core/net-procfs.c,可以知道上述指标是通过其中的dev_seq_show()函数和dev_seq_printf_stats()函数输出的:
1 2 3 4 5 6 7 8 9 10 11 12 13 14 15 16 17 18 19 20 21 22 23 24 25 26 27 28 29 30 31 32 33 34 35 36 37 38 39 40 41 |